How to Fight Over Innovation, and on What Timescale: Thinking in 12 Cells
This article was machine-translated from Japanese by AI (Claude). It may contain errors. Read the original Japanese article.
The prototype of the gasoline automobile was built by Benz in Germany in 1886. It was Ford in the United States who brought it to mass production on a moving assembly line. After the war, Japanese automakers refined their production methods and quality control, improved price and reliability, and built a major position in the global market.
Benz, who established a new product principle; Ford, who built the system of mass production; and the Japanese firms, who kept improving quality and cost on the production floor: each brought different knowledge and organizational capabilities, and each created and captured economic value at its own stage. However, winning at an earlier stage did not mean continuing to win at a later one, and the country or company that led in invention did not necessarily capture the greatest economic value.
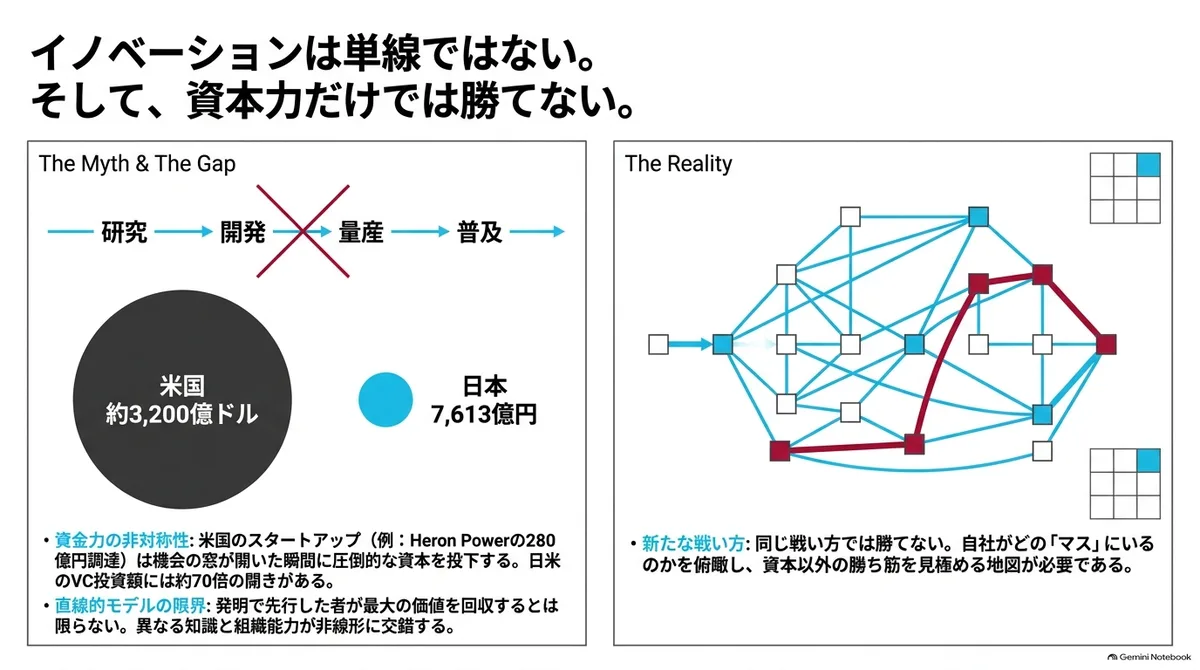
We tend to picture innovation as a single flow that proceeds from research to development, commercialization, mass production, and diffusion, and we tend to think that whoever manages the research and development first wins. But as I wrote previously in "Innovation Is Not 'Linear'", the order in which technology advances is not linear, and leading in research and development does not automatically bring economic value.
I have looked back over this framing and history because Japan's current discussion of innovation tends to take the United States as its model, and policy support is also trying to align with it. The American approach, which combines large-scale investment in frontier research with the exploration of what available technology such as software can do, and then injects large amounts of VC funding to expand the business rapidly, has produced great results, and there is every chance it will produce results in Japan in the future as well.
However, looking at American startups lately, the situations in Japan and the United States seem to be diverging somewhat.
For example, Heron Power is a transformer startup founded in 2024 by a former senior Tesla executive. Catching the rise in data center demand, it has raised a cumulative $178 million (about 28 billion yen) (I also introduced it earlier on YouTube). Sales of its product, the solid-state transformer (SST), are planned for 2027, yet it has already secured 50 GW in advance orders. Only a few years after its founding, it is trying to put the business and the technology together while the window of opportunity is open.
The first thing that makes this possible is probably the difference in the amount of capital. In 2025, US VC investment was about $320 billion, while Japanese startup fundraising was 761.3 billion yen. Simply converting at 160 yen to the dollar, that is a gap of about 70 times. The size of each individual investment is also larger in the United States.
If a company in Japan tried to make the same product as Heron Power and fight the same way, it would struggle even to raise the first tens of millions of yen, and it is easy to imagine that raising 28 billion yen within two years of founding would be difficult, so it would miss the timing of the window of opportunity opened by data center construction. Considering the gap between the two sides, I feel that it is hard to win by fighting the same way.
Given this situation, I feel that we have to think again about what kinds of fights are available to Japanese startups and other companies, and where and how they can win, so I am setting down my current framing here.
Demand and Supply
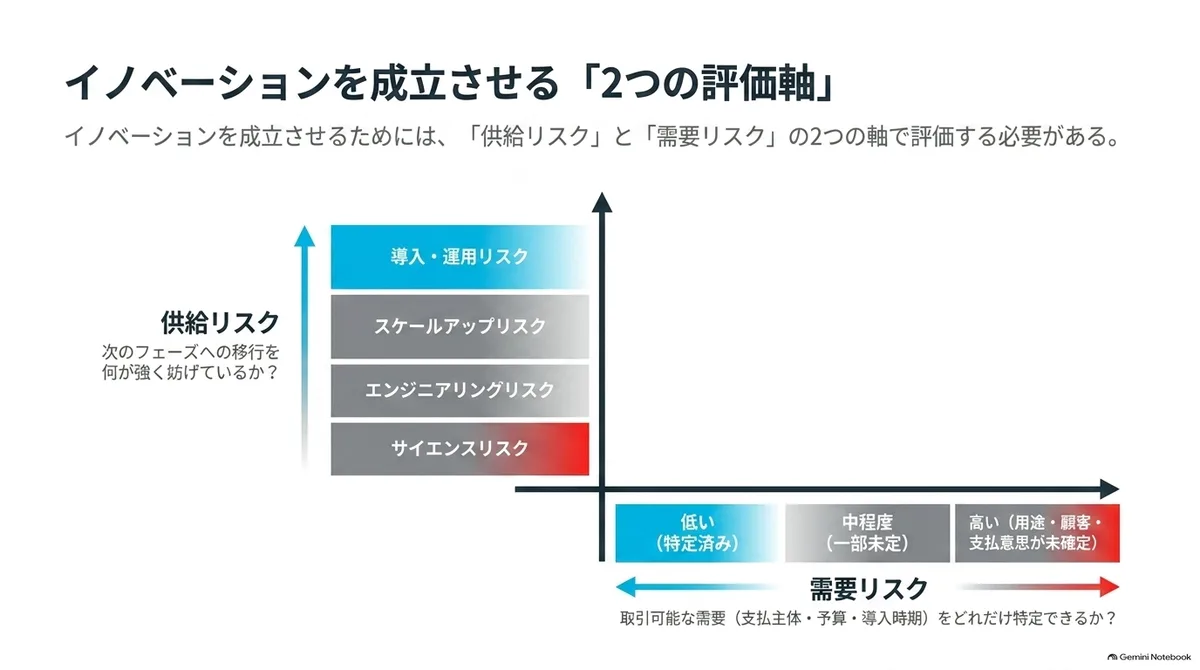
As I also summarized briefly in the article "Organizing Startups by 'Demand Risk vs. Supply Risk' and 'Bottom-Up vs. Top-Down'", for innovation to become economic value, the side that makes (supply) and the side that buys (demand) must come together.
Supply is the side that makes and delivers technology or products with the required performance, safety, price, and quantity. It covers everything from scientific feasibility, through the integration of multiple technologies, mass-production processes, and introduction at customer sites, to operation and maintenance.
Demand is the side that adopts, keeps using, and pays. Only when a problem exists, a buyer with a budget and a paying party are present, and the procedure and timing for deciding on adoption are visible does it become demand that can be transacted.
Of course, even when supply and demand are both visible, the two do not necessarily turn into a repeatable transaction as they are. For the transformers at the beginning, conformity to standards, connection to power transmission and distribution equipment, and securing funds for expanded production are also important elements. In what follows, I will for now place only supply and demand on the two axes, and organize the conditions of institutions, shared infrastructure, and finance later.
Four Kinds of Supply Risk
On the supply side, we look at "what is most strongly preventing the move to the next state." I call this supply risk, and, taking TRL as a reference, I divide it into the following four kinds.
- Deployment and operation risk - Whether a finished product or service can be deployed repeatedly to different customers and sites, and operated and maintained stably. The focus is whether the same result can be reproduced while absorbing the differences between sites, as in housing construction, power transmission and distribution work, and implementation support for business software.
- Scale-up risk - Whether the required quantity can be supplied continuously at the target cost, quality, and delivery time. This includes not only products made in factories but also GPU computing capacity, construction capacity, power generation capacity, logistics capacity, and services supplied by specialized personnel.
- Engineering risk - Whether multiple elements can be integrated and meet the required performance, safety, and reliability in the intended real environment. The integration of technologies inside a product and system design are handled in this row.
- Science risk - Whether the intended physical phenomena, biological effects, therapeutic effects, and so on hold in a reproducible form. It includes not only observing the principle but also whether the effect size and causal relationships can be verified externally.
| Supply risk | Question for judging | Representative indicators |
|---|---|---|
| Deployment and operation risk | Can it be deployed and operated repeatedly at multiple customers and sites? | Deployment time, on-time delivery rate, utilization rate, maintenance effort, project profitability |
| Scale-up risk | Can the required volume be supplied continuously at the target cost, quality, and delivery time? | Yield, unit cost, production time, defect rate, annual supply volume |
| Engineering risk | Does it meet the required performance, safety, and reliability in the real environment? | Performance values, failure rate, durability, integration tests, test results for certification |
| Science risk | Does the intended phenomenon or effect hold in a reproducible way? | Effect size, reproducibility, external verification, clinical results, causal evidence |
Three Levels of Demand Risk
The axis on the demand side is demand risk. We mainly look at how well a transactable demand can be identified.
- Low - The use, customer, required performance, paying party, budget, and timing of deployment can be broadly identified.
- Medium - The need and candidate customers are visible, but some of the paying party, budget, timing of deployment, required specifications, and price are not yet fixed.
- High - At least one of the use, customer, and willingness to pay is undetermined. The recognition that something is "socially necessary" alone is not judged to mean low demand risk.
Demand risk includes not only the risk of being unable to identify the buyer but also the risk that the quantity or timing of visible demand will change. The latter does not become zero even in the low-demand-risk column. Because capacity expansion involves a time lag of years, demand can have slowed by the time facilities are completed after orders have concentrated, which produces cycles of overcapacity such as the silicon cycle in semiconductors.
Organizing by the 12 Cells
Crossing the organization of demand and supply above gives 12 cells, and each calls for a different kind of competition and management. Below, I give each cell a name for convenience and refer to it by the numbers (1) to (12).
| Dominant supply risk \ Demand risk | Low | Medium | High |
|---|---|---|---|
| Deployment and operation risk | (1) Rollout competition——housing construction, power transmission and distribution work, installation and maintenance of charging equipment | (2) Project-development-type implementation——hydrogen supply networks, grid use of storage batteries, CCUS transport and storage | (3) Paid use-case exploration——AI business apps, serving and delivery robots |
| Scale-up risk | (4) Capacity competition——transformers, power cables, GPU computing capacity | (5) Staged scale-up——SAF, low-carbon cement, electrolyzers | (6) Simultaneous exploration of mass production and use——graphene materials, cultured meat, synthetic-biology-derived materials |
| Engineering risk | (7) Target-specification development——new transformers, reusable rockets, autonomous systems for specific missions | (8) Roadmap-led development——EUV lithography equipment in the 1990s and 2000s, solid-state batteries | (9) Simultaneous exploration of product and use——general-purpose humanoids, new uses of quantum sensors |
| Science risk | (10) Mission-type verification——new vaccine candidates during a pandemic, Alzheimer's disease treatments | (11) Option-building research——mRNA platform technology in the 2000s, nuclear fusion | (12) Frontier exploration——on the eve of deep learning, on the eve of CRISPR, new physical phenomena |
Please think of these 12 cells not as boxes for classifying companies or industries but as units that show the state of each business. As technology development and demand change, the position of a single business changes, and so does the way it should fight.
Startups have traditionally centered on cell (3), or on (10) in drug discovery and the like, but one way to understand it is that, because the amount of capital that can be handled has grown, mainly in the United States, they can now also cover cells such as (4), (6), (7), and (9).
And in Japan, everything other than (1) and (3) is lumped together under the word "deep tech," so I also feel that each company's way of fighting and the ways of supporting them are not properly placed.
Three External Risks That Create Time Differences Within the Same Cell
The 12 cells show what a company or research organization needs to learn next, internally. In this article, I call the uncertainty and difficulty of coordination relating to institutions, shared infrastructure, and finance external risks. External risks are not axes that determine the 12 cells; they are auxiliary tags that stretch or shrink the time required in each cell. The three are not added together; for each project, the dominant external risk is identified.
| Auxiliary tag | What to check |
|---|---|
| Institutional and social acceptance risk | Can it proceed under existing permits, regulations, standards, and siting rules? Is new consensus-building needed? |
| Shared infrastructure and connection risk | Can existing power grids, communication networks, transport facilities, testing facilities, and shared data infrastructure be used or connected to? |
| Financial viability risk | Can financing, guarantees, insurance, and equity that fit the duration and risk of the project be raised? |
Each of the three external risks is rated low, medium, or high. It is low if existing institutions, infrastructure, and finance can be used as they are, medium if individual coordination or reinforcement is required, and high if progress is impossible without building a new mechanism among multiple parties. An external resource whose terms of use are stable is treated as low risk even if the business depends on it. The amount required for a factory or demonstration facility is treated separately as the physical scale specific to the project. What financial viability risk looks at is whether funds that fit that amount and the business period can be raised. DOE's Core Risk Areas likewise evaluate capital supply, project formation, infrastructure, manufacturing and supply chains, regulation, and permitting as separate risks.
Integration and certification are where the boundary with the 12 cells easily becomes blurred. Integration, which combines multiple technologies inside a product, falls in the engineering risk row. The work of embedding a finished product into a customer's equipment or operations is in the deployment and operation risk row. Connecting to shared systems such as power grids and transport networks is treated as shared infrastructure and connection risk. The task of producing the performance evidence needed for certification is placed on the engineering side, while the uncertainty of the regulatory pathway and the timing of review is placed under institutional and social acceptance risk.
Estimating Time from the 12 Cells
Time is not an independent classification axis; it is determined by adding the physical scale specific to the project and the dominant external risk to the basic idea that the dominant risk and the demand risk create.
As hypotheses for the durations: (1) and (4), where the main task is deployment or expanded production for visible demand, take 2 to 3 years. (7) to (9), where prototyping, technology integration, qualification, and fine-tuning with customers remain, take 5 to 15 years. (10) to (12), where the discovery of principles, verification of effects, and establishment of reproducibility remain, take 10 to 30 years.
In table form, it looks like this.
| Dominant supply risk \ Demand risk | Low | Medium | High |
|---|---|---|---|
| Deployment and operation risk | (1) 2-3 years | (2) 5-10+ years | (3) 3-7 years |
| Scale-up risk | (4) 2-3 years | (5) 5-10 years | (6) 5-10 years |
| Engineering risk | (7) 5-10 years | (8) 10-15 years | (9) 5-15 years |
| Science risk | (10) around 10 years | (11) 10-20 years | (12) 10-30 years |
(None of the numbers of years are measured values; they are hypotheses about durations drawn from this article's framework. They stretch or shrink depending on the physical scale specific to the project and the three external risks.)
Looking at the table by column, in the top two rows, the middle column can take longer than the right column. The time spent on exploration can be shortened by the speed of a company's own experiments, whereas the time spent waiting for conditions that others put in place, such as permits and shared infrastructure, is hard to shorten by a company's own efforts alone.
If institutional and social acceptance risk or shared infrastructure and connection risk is high, the duration lengthens, and (2) can exceed ten years depending on how permits and shared infrastructure are put in place. On the other hand, if demand is pressing and parallel investment in the development and testing of multiple candidates is possible while using existing facilities, (10) in particular can be compressed to a few years.
And in some cases, capital can shorten time even along a path that does not advance linearly. Organizing that path along the four supply risks gives the following.
| Category | What capital can easily shorten | Time that is hard to shorten even with more capital |
|---|---|---|
| (1)-(3) Deployment and operation risk | Deployment teams, construction staff, and maintenance personnel can be increased, and multiple sites can be started up in parallel. | Coordination with customers, learning the differences between sites, and the repetition of operation and maintenance take time. |
| (4)-(6) Scale-up risk | Facilities, personnel, and components can be secured in advance, and supply capacity can be increased. | Procuring long-lead-time equipment and improving yield and quality take time. |
| (7)-(9) Engineering risk | Prototyping and testing can be run in parallel, and multiple design options can be verified at the same time. | Technology integration, qualification, and fine-tuning with customers require iteration over years. |
| (10)-(12) Science risk | Multiple research paths and candidates can be tried in parallel. | Forming research talent, accumulating knowledge, and establishing reproducibility require calendar time. |
Capital can parallelize facilities and trials and push forward all at once, but it cannot skip the time it takes for knowledge, institutions, and learning at the site to accumulate.
A Business Moves Among the 12 Cells over Time
At each stage of a business, it moves around within the 12 cells.
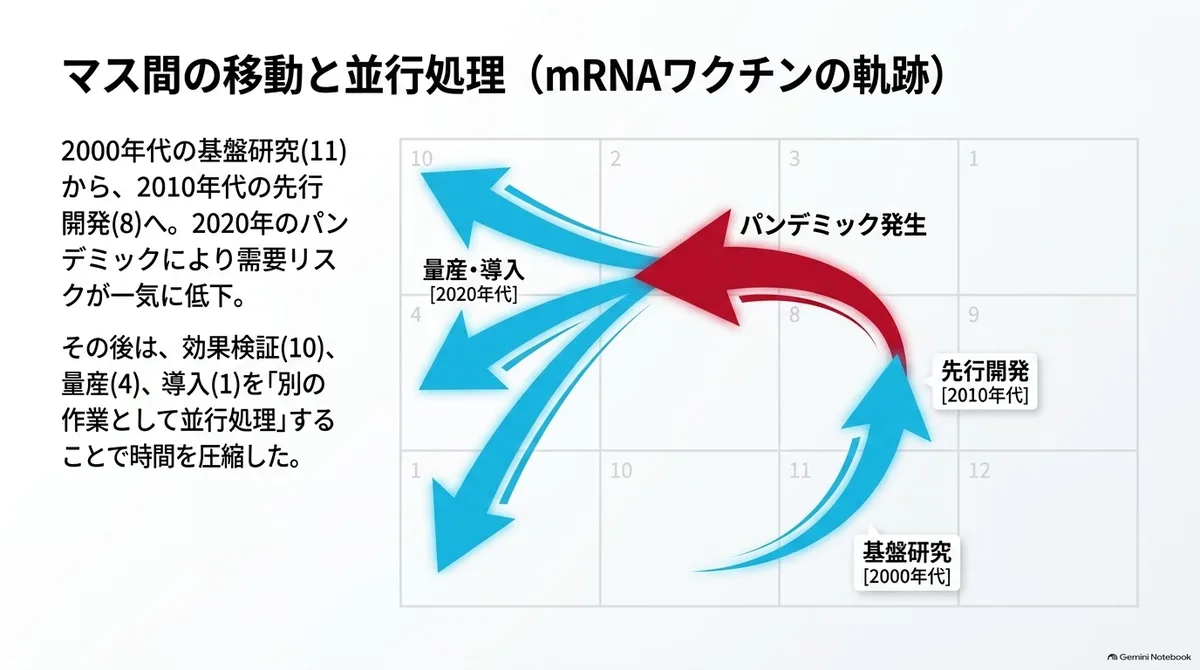
As the supply side learns, the kind of risk changes, and on the demand side, in addition to the company's own learning, risk can rise or fall as the business environment changes (the recent changes in AI, for example, were a case where both supply and demand changed at once). Usually, a business moves from the science row toward the deployment and operation row, but failures or insufficient effects discovered in the field can send it back to the engineering or science rows. Note that the development of institutions and shared infrastructure and the improvement of financial viability are reductions in external risk that do not involve a move between cells.
However, a business does not simply climb step by step from (12) to (1). For a business opportunity that appears suddenly, like the transformers for data centers in the opening example, competition may begin abruptly at (7) or (4), and unless the business wins decisively within the period in which the window of opportunity is open, it cannot be established, making it a race against time.
I said at the beginning that innovation is not linear. The technology itself may grow linearly (its performance and so on may keep improving), but the important point is that the businesses that use that technology, and the economic value of the innovation born from them, never change linearly.
It is also necessary to distinguish between placing one business in one cell and having multiple tasks proceed in parallel across a whole industry. When dealing with a group of technologies or an industry, it must be divided into units of work, such as verification of effects, expansion of manufacturing, and deployment in the field, and each must be placed in a separate cell.
mRNA technology is a good example of this movement. In the 2000s, it was in a position close to (11) option-building research, confirming the effects of the platform technology and the conditions of future demand. In the 2010s, it moved into the engineering risk row, including delivery technology and manufacturing methods, that is, (8) roadmap-led development, and the pandemic in the spring of 2020 was the turning point that sharply lowered demand risk. After that, the verification of effects for each candidate was handled as (10), the expansion of supply capacity as (4), and the deployment and operation of vaccination as (1), as separate tasks proceeding in parallel.
The Two Rows That Compete on Repetition Capability
In deployment and operation risk and scale-up risk, repetition capability, more than the technology itself, decides who wins. In the left column, where demand risk is low, the speed of capital and mobilization tends to decide the contest.
In (1) rollout competition, firms compete on the ability to repeatedly deploy finished supply to customer sites and put it into operation. For housing construction and charging equipment, the main constraints are construction personnel, site coordination, maintenance networks, and procedures that differ by region. In (4) capacity competition, as with transformers and GPU computing capacity, the focus is whether the required volume can be supplied within the delivery time. The side that secures facilities, personnel, and components first, and brings up supply capacity while the window of demand is open, has the advantage. The remaining demand risk is the fluctuation in quantity and timing, and if demand has slowed by the time every company's expansion is completed at once, the capacity secured could turn into overcapacity.
When demand risk is medium, the way of fighting is to build the conditions for victory while making good use of waiting time. In (2) project-development-type implementation, even when there are candidate buyers, deployment is impossible until institutions, connections, operating responsibility, and payment terms are in place. If already-completed technology is used, then in hydrogen supply networks and CCUS transport and storage, the point of contention is who puts these external conditions in place. In (5) staged scale-up, facilities are increased in line with future demand. In projects such as SAF and low-carbon cement, the focus will probably be whether demand risk can be transferred to buyers or governments through offtake contracts or government guarantees, converting future demand into present investment.
In the right column, where demand risk is high, supply and the market are learned at the same time. (3) Paid use-case exploration is the movement, as with AI business apps, of repeating small deployments to find the work in which the product is actually used and the way to operate it. In addition to who uses it, who decides on adoption, and who pays, what gets verified extends to the revenue model, including price and form of provision. (6) Simultaneous exploration of mass production and use, as with graphene materials and synthetic-biology-derived materials, searches for uses whose price and performance fit while improving the process. They should not be classified by material name alone; they need to be evaluated with the use limited, as with heat-dissipation materials for data centers or water treatment membranes.
In these two rows, learning gained from repeated production and deployment is one source of competitiveness. As with Japanese automakers after the war, and with the recent Chinese solar and battery industries, if a company accumulates on-site knowledge of yield, quality, cost, and maintenance in the course of repeating production and deployment, it develops an advantage that latecomers can hardly imitate in a short time.
How the Side with Less Capital Can Win
Of these two rows, (1) and (4), where demand risk is low, tend to become contests of capital, and are areas that favor large companies that already have capital or American startups that can gather capital all at once. That said, are they places to be abandoned by the side with less capital? I think there are some exceptions. For example, strategies like the following.
(1) Hold the slow element within a fast competition. In the data center race, power allocation, transformers, optical components, and construction capacity cannot be increased quickly. In fact, the companies that captured the data center demand from generative AI were firms such as Fujikura, which has long made optical wiring and electric wire, and Furukawa Electric. A capacity competition that arises suddenly is decided by the supply capacity one has held since yesterday. Recently, I also hear of cases where even materials startups have suddenly opened up possibilities by applying materials they have cultivated over many years to semiconductor materials, cooling, and so on.
(2) Move to the side that sells to all participants in the competition. If you are in a position needed no matter which camp wins, such as the position NVIDIA and TSMC have taken today, demand increases as the competition intensifies.
(3) Turn institutions and on-site knowledge into barriers to entry. In markets where regulation, language, connection to existing infrastructure, and trust with the field are deeply intertwined, deployment speed does not rise simply by piling on capital. Construction and nursing care, for example, probably differ from country to country, so even if humanoids become capable abroad, they will not easily make their way into Japan.
(4) Secure contracts and connections first. If you sign long-term supply contracts immediately after demand becomes apparent and complete certification and integration into customer facilities, the room for latecomers to enter narrows. The multi-year long-term supply contracts signed in the semiconductor industry when supply is tight are a tool of this type.
What the four ways of fighting have in common is building, inside the competition, capabilities that cannot easily be caught up with by the amount of capital alone.
The Row That Makes Products and Systems Work
In the engineering risk row, iteration is needed until multiple elements are integrated and meet the required performance in the real environment. The lower the demand risk, the easier it is to write target specifications, and the easier parallel development with capital becomes.
In (7) target-specification development, the customer, mission, required performance, and paying party are visible. As with reusable rockets and autonomous systems for specific missions, numerical targets are written from the demand side, and prototyping and testing proceed in parallel to shorten the period. It is important to fix the specifications, for example by obtaining LOIs in advance wherever possible. Through initial procurement or contract-based research and development, buyers can also take on part of the development risk.
In (8) roadmap-led development, the performance that will be needed in the future is visible, but the timing of adoption, the specifications, and the price are not yet fixed. As with EUV lithography equipment in the 1990s and 2000s and solid-state batteries, development continues from before demand is settled, repeating customer evaluation and inter-company collaboration. Time is hard to buy with money alone because qualification and fine-tuning require iteration over years. Still, which roadmap one rides on will probably be a major fork in the road. For example, even if you ride the CHAdeMO roadmap, if CHAdeMO itself does not win, neither will you.
In (9) simultaneous exploration of product and use, the use is explored while the product is being made to work. For general-purpose humanoids and new uses of quantum sensors, which requirements to prioritize is itself undecided. Rather than aiming for a single finished form while keeping the uses broad, it is necessary to split the work into prototypes and customer verification with limited uses.
The device that moves this row to the left is demand creation. NASA's commercial procurement supported SpaceX's growth, and Germany's feed-in tariff boosted the expansion of the solar market. On the other hand, most of the demand created there was captured by Chinese manufacturing.
Policies that create demand must be combined with a design that also develops domestic supply and deployment capacity, or the value flows outside the region. Rule-making is a move that lowers institutional and social acceptance risk, but spreading a standard and capturing revenue are separate tasks.
The Row That Confirms Principles and Effects
In the science risk row, we confirm whether physical phenomena, biological effects, therapeutic effects, and so on are reproducible. In this row, even if capital is increased, the formation of research talent and the accumulation of knowledge cannot be sped up in the same proportion.
In (10) mission-type verification, the problem to be solved, the required effect, and the paying party are clear. As with new vaccine candidates during a pandemic and Alzheimer's disease treatments, target values for the effect can be written from the demand side. If demand is pressing, time can be compressed through parallel testing of multiple candidates and advance production, but the verification of efficacy itself cannot be skipped.
In (11) option-building research, the future need is visible, but the timing, specifications, and price are not fixed. In this article, I treat mRNA platform technology in the 2000s and nuclear fusion as investments in building, in advance, technology paths that can be used in the future. Demand for fusion is conditional on "if it can be supplied at a competitive price," and it is necessary not to mistake social necessity alone for low demand risk.
In (12) frontier exploration, neither what is possible nor what it would be used for is settled. In neural network research on the eve of deep learning and in bacterial immunity research on the eve of CRISPR, the results appeared not as sales but as reproducible knowledge and an increase in technology paths that could be chosen in the future. The main players are likely to be universities and public funding.
If this row is measured by enterprise value or by sales within a few years, research becomes biased toward work close to existing products. The Focused Research Organizations (FROs) being tried in the United States are an organizational form that assigns a dedicated team to one technological goal and gives it a lump sum of funding on the scale of 3 to 7 years and $20 million to $50 million. In this article's terms, they can be called an attempt to carry out option-building research in an organized way.
Drug discovery is where one can most easily go from science straight to practical use, and it is close to (10). Although there are external risks such as regulation and experiments, there are often no stages of engineering risk, scale-up risk, or deployment and operation risk to pass through, so it can be called an area where science and practical use are close. AI using the Transformer this time is also something that was put to practical use from science in a fairly short time. However, unlike drug discovery, AI has scale-up risk such as infrastructure development.
Cells That Startups Can Enter Easily
The 12 cells also differ in their fit with startups. The subject here is the high-growth startup, which uses external equity such as VC to aim for high growth. The fit between each cell and startups is determined by whether a company can experiment with limited people and capital and show that uncertainty has decreased by the time of the next fundraising. The more it can verify in small steps and accumulate learning inside the company, the more a startup's speed pays off. On the other hand, if the risks in institutions, shared infrastructure, and finance are high, the difficulty rises even within the same cell.
| Position | Cells | Fit with startups |
|---|---|---|
| Good fit at founding | (3), (7) | Through customer demonstrations and prototyping, the use, required specifications, and product can be verified in small steps. |
| Viable if conditions are met | (6), (8), (9), (10) | Technical milestones can be created, but long-term capital, co-development partners, and public funding are needed. |
| Fit rises after growth | (1), (4) | The implementation and mass-production stages after demand has become visible. They are less an entry point for founding than a destination for scaling up. |
| Hard to advance with one company | (2), (5) | They depend on conditions outside the company, such as permits, shared infrastructure, offtake, and large-scale facilities. |
| Easier for research organizations to carry | (11), (12) | Knowledge is accumulated at universities, public research institutes, FROs, and the like, and spinning out at the stage of moving to (10), (9), or (7) is suitable. |
I should note, however, that there are various exceptions. For example, (9) explores use and product at the same time, so even if the failure rate is high, a startup may have the advantage over existing organizations if it can repeat small prototypes and changes of direction. And a transformer would be (4) if it is an existing transformer, but if it is a transformer that requires new development, it comes closer to (7), in which case both engineering risk and scale-up risk arise, and a startup may turn out to be better suited.
Opportunities to Start a Company Lie at the Boundaries Between Cells
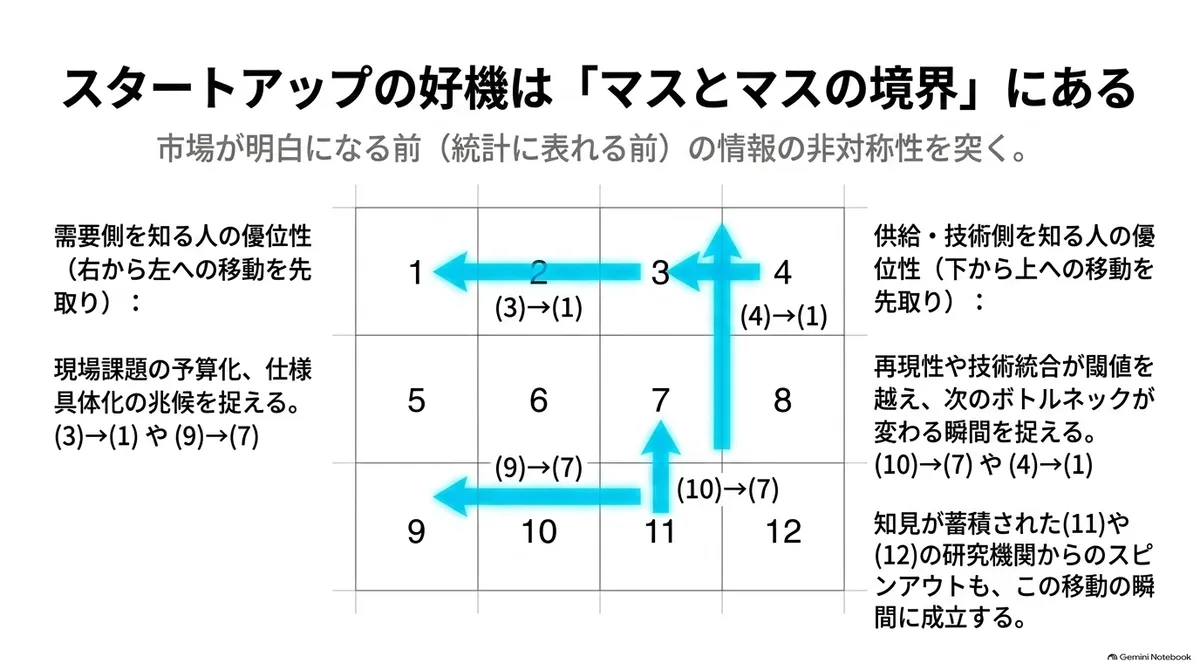
It seems to me that opportunities to start a company appear at the moment a project begins moving to the next cell. This is because the people involved can catch the signs before the change becomes widely known.
| Entrepreneur's informational advantage | Changes visible first | Moves that can be anticipated |
|---|---|---|
| People who know the demand side | Budgeting of on-site problems, the paying party, the timing of deployment, and the concretization of required specifications | Moves from right to left——(3)→(1), (9)→(7), (6)→(4) |
| People who know the supply and technology side | Signs that reproducibility, performance, technology integration, and yield have crossed a threshold and the next bottleneck is changing | Moves from bottom to top——(10)→(7), (7)→(4), (4)→(1) |
| Teams that connect both sides | Work where the frontier of the technology overlaps with the conditions of a specific site | Cut out the work just before a move as one project and make it the unit of founding |
People who know the demand side well can see changes in budgeting and procurement conditions that do not yet show up in statistics. What people who know the supply and technology side deeply catch is the moment when a research problem becomes a product-integration problem, and a product problem becomes a problem of mass production or operation. This information gap is the basis for founding a company before the market becomes obvious. And the contest is whether, during the period until that information gap closes, one can build an advantage that capital alone cannot catch up with.
Typically, the application type proceeds from (3) to (1), and the deep tech type proceeds from (9) or (10) to (7), (4), and (1). (11) and (12) are carried out in research organizations, and the point at which they can be cut out as problems of (10), (9), or (7) is a candidate for a spinout.
Practical Practices for Each Cell
The methods used in daily work also change from cell to cell. Since the uncertainty to be resolved differs, the tools for confirming it differ as well.
For example, techno-economic analysis (TEA) is a method that estimates the cost of a process and identifies the conditions under which the economics hold. It is placed at the center in (5) staged scale-up and (6) simultaneous exploration of mass production and use, but plays a smaller part in (1) rollout competition, where the process is already established. Conversely, customer development, which is indispensable in (3) paid use-case exploration, probably carries less weight in (7) target-specification development, where the required specifications can be written from the demand side. Which method is effective is determined by the kind of uncertainty one is trying to resolve right now. Lining up representative examples for each cell, together with the order in which to use the corresponding prompts, gives the following.
| Cell | Central question | Representative practices of the people involved | Prompts for research and design |
|---|---|---|---|
| (1) Rollout competition | How quickly and cheaply can the same result be repeated? | Standardization of construction and deployment, process management, building maintenance networks and talent pipelines, KPI management of utilization rate and project profitability | Unit Economics → 初期・中期・最終形のオペレーション設計 → 組織・採用・アドバイザー設計 |
| (2) Project-development-type implementation | Which agreements should be put in place, and in what order? | Project development, FEED (front-end engineering design), prior consultation with regulators, consortium formation, offtake negotiation | FEL / FEED計画(設備型事業向け) → 規制・認証・標準化ロードマップ → アライアンス・パートナー戦略 → バリューチェーン / 商流設計 |
| (3) Paid use-case exploration | In whose work, and from whom, will continuing payment arise? | Customer development, repeated small-scale PoCs, turning deployment into templates, verification of unit economics | Wedge / 初期ユースケース選定 → 顧客検証・インタビュー設計 → PoC / 実証実験設計 → 価格・ユニットエコノミクス設計 |
| (4) Capacity competition | If the current constraint is resolved, what becomes scarce next? | Demand forecasting, advance securing of long-lead-time components, management of mass-production ramp-up, sales of long-term supply contracts | 市場調査(検証版) → Next ボトルネック予測 → 部材・設備・サプライヤー調達戦略 → 量産・スケールアップ戦略 |
| (5) Staged scale-up | How can future demand be converted into present investment? | TEA, design of cost curves and learning, staged investment plans from FOAK to NOAK (from the first unit to mass-produced units) | 技術経済性分析(TEA:FOAK想定) → 技術経済性分析(TEA:NOAK想定) → FOAKからNOAKへのコスト・性能軌道 → 資本政策シナリオ |
| (6) Simultaneous exploration of mass production and use | After costs fall, which use will become viable first? | TEA, evaluation of price-performance fit by use, pilot plants, joint verification with lead users | Wedge / 初期市場・参入方法 → 技術経済性分析(TEA:NOAK想定) → PoC / 実証実験設計 → 価格・ユニットエコノミクス設計 |
| (7) Target-specification development | What is the shortest path to the known required specifications? | Systems engineering, freezing of requirements and design trade-offs, parallelizing prototyping and testing, obtaining LOIs | 成立条件マップ(What Must Be True) → Dependency Graph → 初期プロトタイプ作成法 → PoC / 実証実験設計 |
| (8) Roadmap-led development | What is the industry's constraint after the next? | Co-development and evaluation cycles with customers, participation in industry roadmaps and standardization, back-calculating the qualification plan | ロードマップ → Next ボトルネック予測 → 市場・技術の実現タイムライン → 規制・認証・標準化ロードマップ |
| (9) Simultaneous exploration of product and use | Which use should be narrowed down to so that the specifications can be frozen? | Prototypes limited to a use, customer verification, hypothesis testing of required specifications, staged freezing of specs | Wedge / 初期ユースケース選定 → 初期プロトタイプ作成法 ⇄ 顧客検証・インタビュー設計 → PoC / 実証実験設計 |
| (10) Mission-type verification | Which of the multiple candidates works? | Back-calculating from the target effect (Target Product Profile), parallel testing of multiple candidates, adaptive trial design | Heilmeier Catechism(DARPA) → 成立条件マップ(What Must Be True) → 決定的実験(Killer Experiment) |
| (11) Option-building research | Which technology paths should be kept alive? | Milestone-managed long-term research, ensuring reproducibility and external verification, portfolio management of technology paths | 技術のランドスケープ → SOTA調査・読むべき論文 → 科学・工学・事業分解 → 多軸成熟度評価(xRL) |
| (12) Frontier exploration | How far can what is possible be expanded? | Researcher-led exploration, publication of reproducible knowledge, training of research talent | トピックランドスケープ → 引用ネットワーク → 隣接可能領域(Adjacent Possible) → 第一原理思考 (探索版) |
The assignments are all representative examples. Methods overlap in adjacent cells. Please read it as the row determining the main methods and the column adjusting their mix. The rightmost column gives names listed in the Deep Tech Prompt Library as of August 2026. If you enter a name into the search box exactly as written, you can find the corresponding prompt. The arrows show the rough order of use, and the two-way arrow shows the point where one goes back and forth between customer verification and prototyping.
However, what prompts can handle is limited to desktop research, organizing hypotheses, and creating comparison tables and verification plans. Customer interviews, experiments, consultation with regulators, and contract negotiation remain as the practices of the people involved listed in the third column. Please make good use of it, for example by deciding which cell you are in now, using the first prompt in the rightmost column, and moving on to the next cell once the output has reduced the uncertainty.
Ways of Thinking That Change by Column
Each column has a different way of thinking.
The left column, where demand risk is low, is the speed and foresight type. Since it is known what to make, the contest is how quickly one can meet the demand being asked for. But it is not simply speed; foresight is sometimes also needed. This is because the bottleneck visible now is also visible to competitors and is already priced in. Profit comes from reading the "next bottleneck," that is, "if the current constraint is resolved, what becomes scarce next," and securing resources with long lead times first, so that one stands at a good starting line before the demand becomes apparent and can then advance all at once when the demand comes into view.
In data centers, for example, besides GPUs, power allocation, transformers, grid connections, and construction personnel are all constraints in parallel. Against demand that has become apparent in this way, the contest is decided by speed of execution. Also, I listed "holding the slow element within a fast competition" earlier as a winning path for the side with less capital, and this type is the continuation of that reading along the time axis. When this reading is shared across an entire industry and operated over decades, the result can be called the industry roadmap of (8) in the middle column.
The middle column, where demand risk is medium, is the project-development type. The remaining uncertainty lies in the hands of others, such as regulators, buyers, and financial institutions, and it does not decrease no matter how many experiments the company repeats. The work is to discern which agreement is a precondition for which, and to design the order in which the conditions fall into place. This is why project development and offtake negotiation come to the center of the methods in hydrogen supply networks and SAF projects.
The right column, where demand risk is high, is the exploration type. It learns from the market by repeating cheap and fast experiments. The Lean Startup is applicable in this column, and it can be used as it is in (3) paid use-case exploration. However, the further down the rows one goes, the more the cost and time of each round of learning increase, so its scope of application will shrink to hypotheses on the demand side. In (6) and (9), Lean works for the question of which uses fit in price and performance, but mass-production processes and product integration cannot be pivoted, so on the supply side TEA and systems engineering are used together. In (10) to (12), the counterpart of verification is nature or living organisms rather than the market, and there is little room to make experiments cheap and fast, so there is almost no place for Lean.
Please note, however, that winning and winning big are different. If you secure construction personnel in a region, you may win by getting there first, but a single region will not necessarily make a big business. Even if you commercialize cutting-edge technology and customers want it, if the problem is one where sales stall at around 1 billion yen, you may win the contest in that area but it may not count as a big victory as a business. For a startup, it is preferable to prioritize whether a contest can be a home run rather than the mere win rate.
Also, bringing in the standard methods of another cell tends to cause various kinds of confusion. If you demand verification of unit economics from (11) option-building research, research on a scale of decades turns into a sales plan of a few years. Conversely, if you bring the heavy requirement freezing of systems engineering into the small exploration of (3), the speed of learning drops. Mixing up the speed type and the exploration type is the same: if you build mass-production facilities or deployment structures in advance in (6) or (9), where the use is not settled, the failure of the exploration could remain as overcapacity. When support organizations design accompaniment programs, they too will need to check which cell's methods they are teaching.
Examples
If we put the history of the automobile back onto this table, the principle of the internal combustion engine (12) had been established by earlier generations, such as Otto's four-stroke engine of 1876, and Benz in Germany advanced productization (9) when neither the use nor the customers were yet visible. Ford in the United States built supply capacity and processes in (4) toward the mass demand that was beginning to appear, and Japanese firms, facing an established postwar market, ran deployment and operation (1) and the production process (4) in parallel as separate tasks and accumulated learning from the field. The three countries solved the dominant risks of different cells with different times and organizational capabilities.
With humanoids too, the number changes depending on what is regarded as one business. If the subject is the general-purpose humanoid itself, it is making the product work while also exploring uses, so as of 2026 most of them are probably close to (9) simultaneous exploration of product and use. If the machine side can be regarded as complete, a project that has decided only to use it in the nursing care industry and is searching for specific tasks and payment terms is (3) paid use-case exploration. Suppose a particular nursing care provider defines the use as "assisting transfers from bed to wheelchair." If the weight of users it can handle, the time required per transfer, the number of caregivers needed, and the safety conditions are set, and the paying party can also be identified, the task of finishing the product and system becomes (7) target-specification development. The task of repeatedly deploying the completed system to multiple nursing care facilities is (1) rollout competition. The task of mass-producing the machines to match demand is (5) if demand is not yet settled, and (4) if orders are visible.
In fact, the general-purpose machine and the use-limited case are already positioned differently. In Gemini Robotics 2, announced by Google DeepMind in 2026, the success rate of the multi-fingered hand ranges from 32% to 92% depending on the task, so engineering risk remains for a general-purpose product. On the other hand, Figure 02 operated on BMW's production line for 11 months and handled more than 90,000 parts. Cycle time, placement accuracy, and the number of human interventions are its KPIs, and it can be read as the process of a single task moving from (7) to (1). The case of Agility Robotics' Digit entering multi-year commercial operation with GXO is probably an example of (1) beginning in a limited logistics task.
In the humanoid industry as of 2026, the machine itself is (9), use-specific development is (7), on-site implementation is (3), (2), or (1) depending on demand risk, and mass production splits into (5) and (4), all proceeding at the same time. When thinking about which company will win, too, it is necessary to fix which unit of competition one is referring to.
Summary
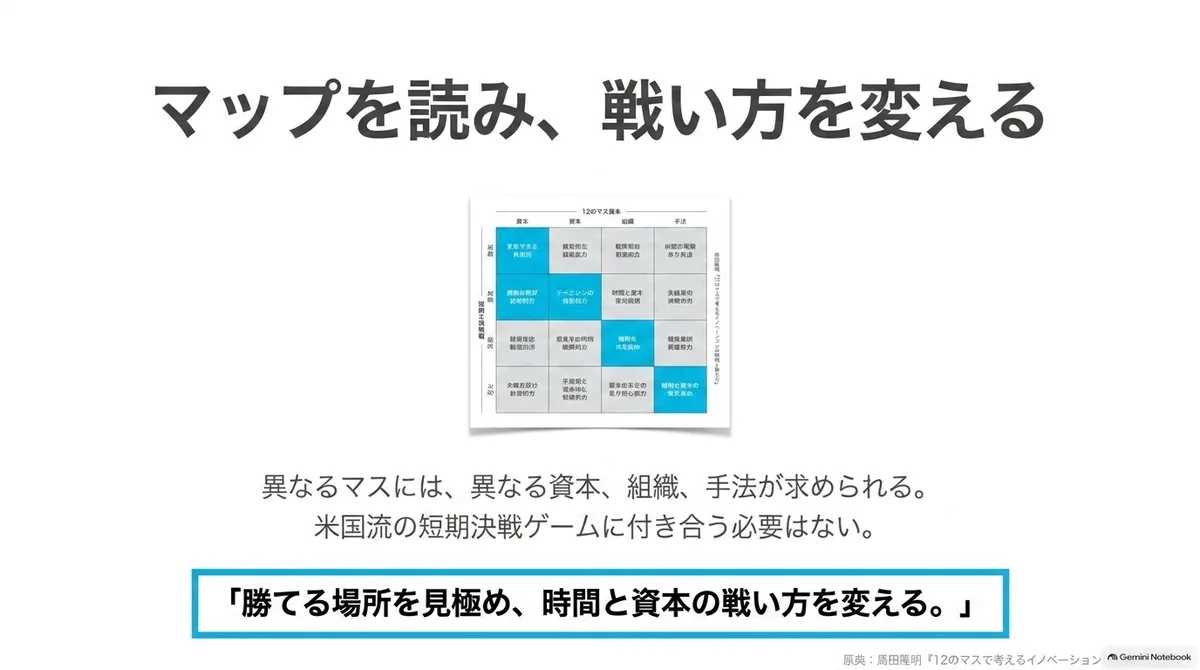
Above, I have divided the dominant supply risk and the demand risk into 12 cells and organized the time and ways of winning expected in each. This framework also makes visible the mechanisms that assign different capital, organizations, and institutions to each cell and hand verified evidence, contracts, and demand over to the next party.
There is a way to win in every cell. What is asked is to identify the uncertainty and external risks that are preventing the next move, and to assign the capital, organization, and institutions that fit the time needed to resolve them. In the deployment and operation and scale-up rows, on-site knowledge gained from repetition and the supply network; in the engineering row, co-development with customers and the repetition of qualification; and in the science row, the organizations and evaluation metrics that support long-term research, each decide who wins and who loses.
And just as the uncertainty to be resolved differs from cell to cell, the devices for capturing the value that is created are not the same either. In the science row, patents; in the two rows of repetition capability, the monopolization of on-site knowledge and long-term contracts and connections; and in every row, the position of supplying parts and infrastructure to all camps regardless of who wins, support the capture of value. The reason I wrote at the beginning that the country that leads in invention does not necessarily capture the greatest economic value is that those devices are often placed in a different cell from the invention. Not measuring different times with a single yardstick, and combining resource allocation according to the 12 cells, is the institutional implication that follows from this article.
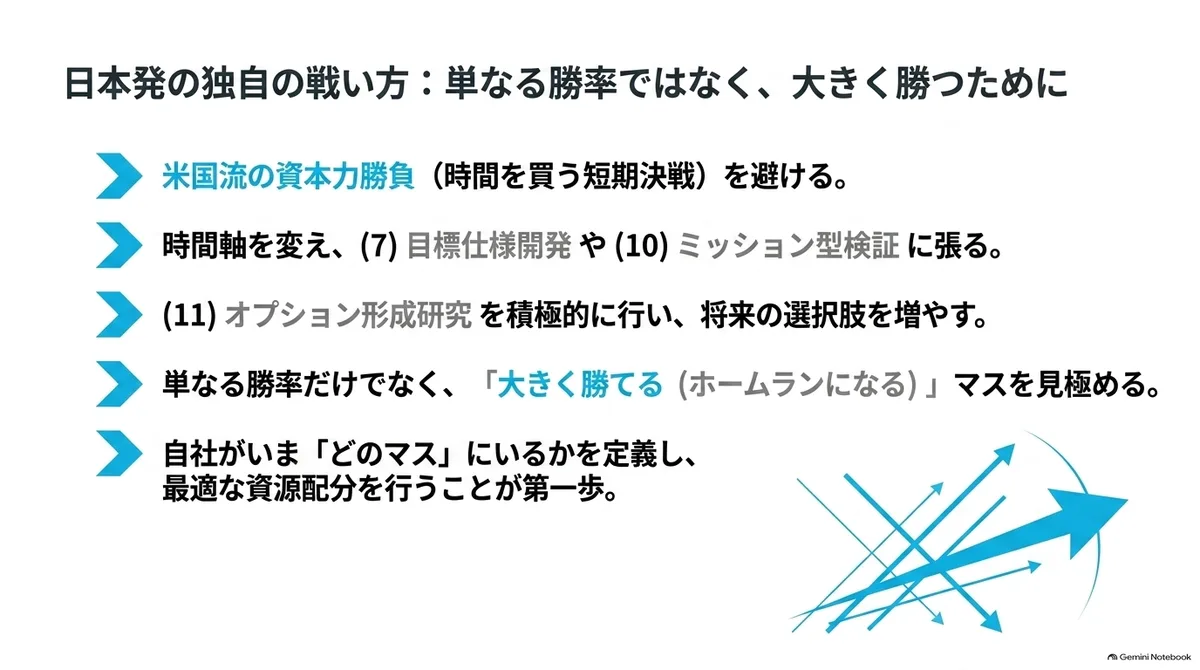
On top of that, I think we need to consider, in each area, which cell the contest is in at present and what kind of contest Japan can fight within it. Since a way of fighting like Heron Power's, discussed at the beginning, is difficult, unless we can look at areas different from those of American startups, or read the future ahead of them, prepare, and fight, it will be hard to win in areas where large growth is possible.
For example, rather than areas where the United States and China excel, buying time with capital and fighting short decisive battles, there are several conceivable moves: changing the time axis and betting on (7) and (10) with thicker support, or actively pursuing (11) to increase options. Rather, if a Japanese founder were to compete in an area where the United States is strong, it would be more rational to move the business to the United States and raise funds there.
I think that taking a way of thinking and an approach different from those of the American startup ecosystem is what will produce Japanese startups that the world needs.
(This manuscript was written with the help of AI.)